9Reports
Every customer is kept, so the board can answer: how fast were we, when were we slow, which register held us up, and how many walked out.
Reports › Front counter
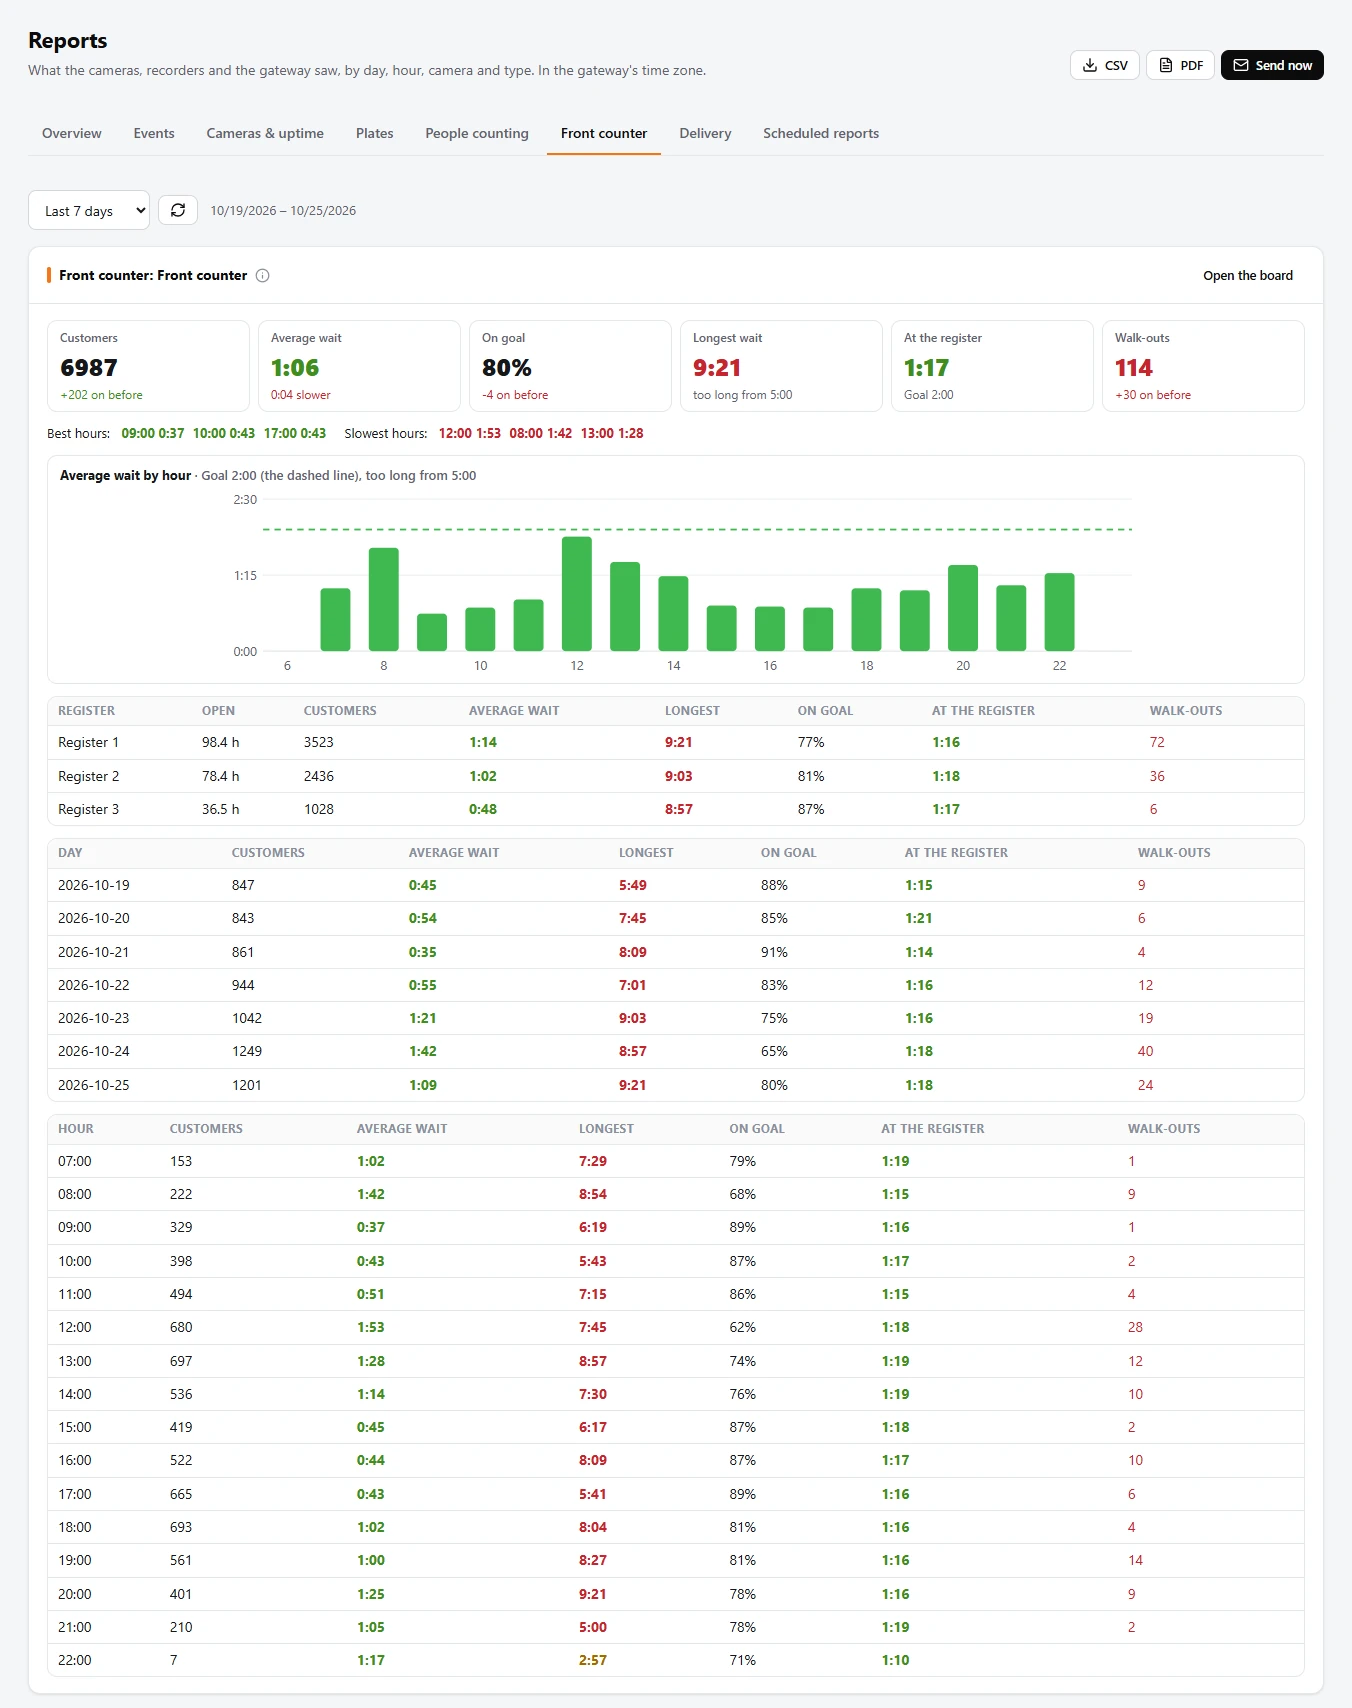
Open Reports and the Front counter tab. Choose a period (Today, Yesterday, Last 7 days, Last 30 days, this or last week or month, or any dates). For each board:
- At the top: customers, the average wait against its goal, the share on goal, the longest wait, the time at the register and walk-outs, each against the period before.
- Best and slowest hours, and the average wait by hour against the goal.
- By register: hours open (from the cashier zone), customers, waits, the share on goal and walk-outs. By day and by hour, the same.
The report's PDF
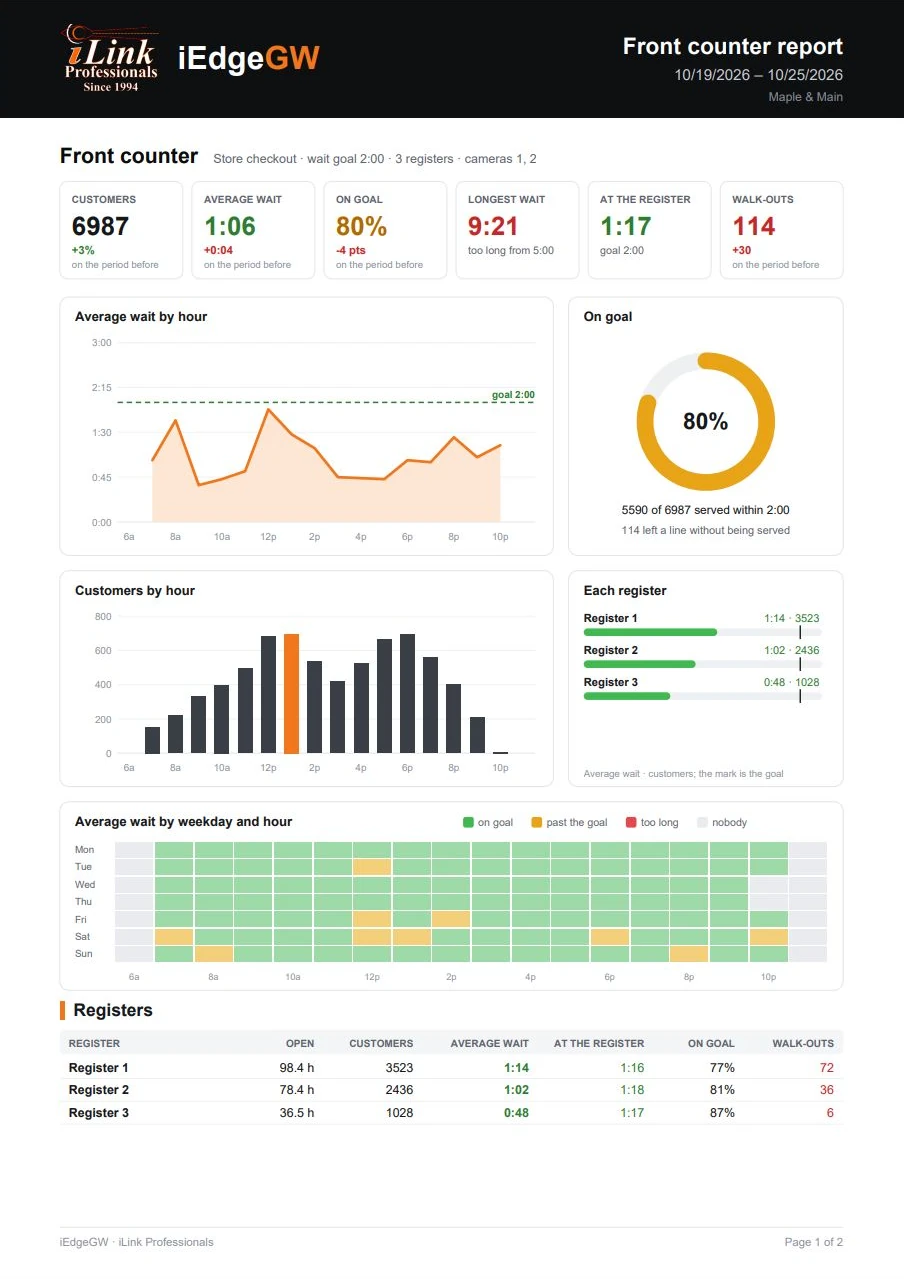
On the Front counter tab, PDF downloads the front counter report on its own, ready to print or forward:
- the six key figures against the period before;
- the average wait by hour with the goal;
- the share on goal;
- customers by hour, the busiest hour marked;
- each register's wait and customers;
- the average wait by weekday and hour: on goal, past the goal, too long;
- the registers and every day of the period, with the best and slowest hours in words.
CSV downloads the same numbers for a spreadsheet.
Send it now, or on a schedule
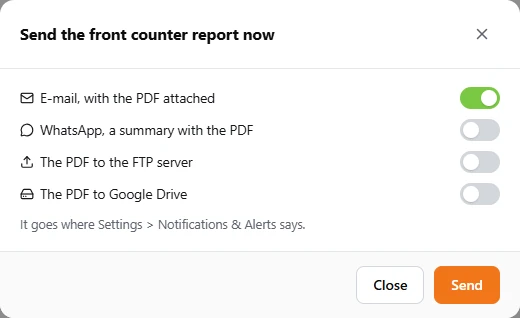
Send now (admins) sends the report on screen at once, wherever you tick.
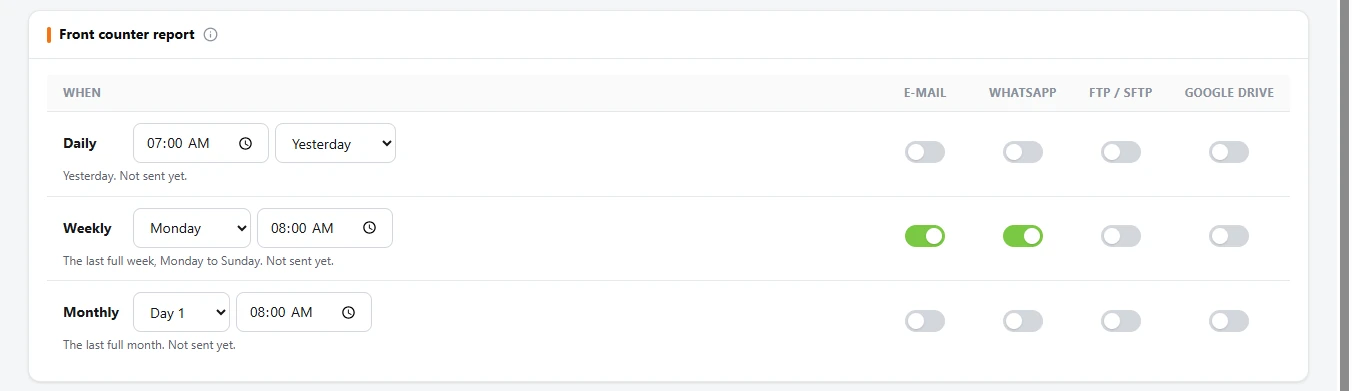
On Reports › Scheduled reports, the Front counter report has its own Daily, Weekly and Monthly rows. Choose the time (and the weekday or day of the month), switch on where it goes, and click Save. A report missed while the gateway was off goes out when it is back, up to 12 hours late.